Documentation · Jira Cloud · Toine.com B.V.
Throughput and Cycle Time for Jira
How much work finishes each week and how long one item really takes. Median, 85th and 95th percentile cycle times, a scatter of every finished item, and a verdict on whether a forecast built on these numbers will hold.
Marketplace listing · 30 day free trial, paid via Atlassian · Support: contact@toine.com · Updated 2026-10-07
What it does
Throughput and Cycle Time for Jira answers the two questions a delivery lead is asked in every planning session: how much can we get through, and how long will one thing take?
It reads the full status history of your work items straight from Jira and turns it into numbers a team can commit to.
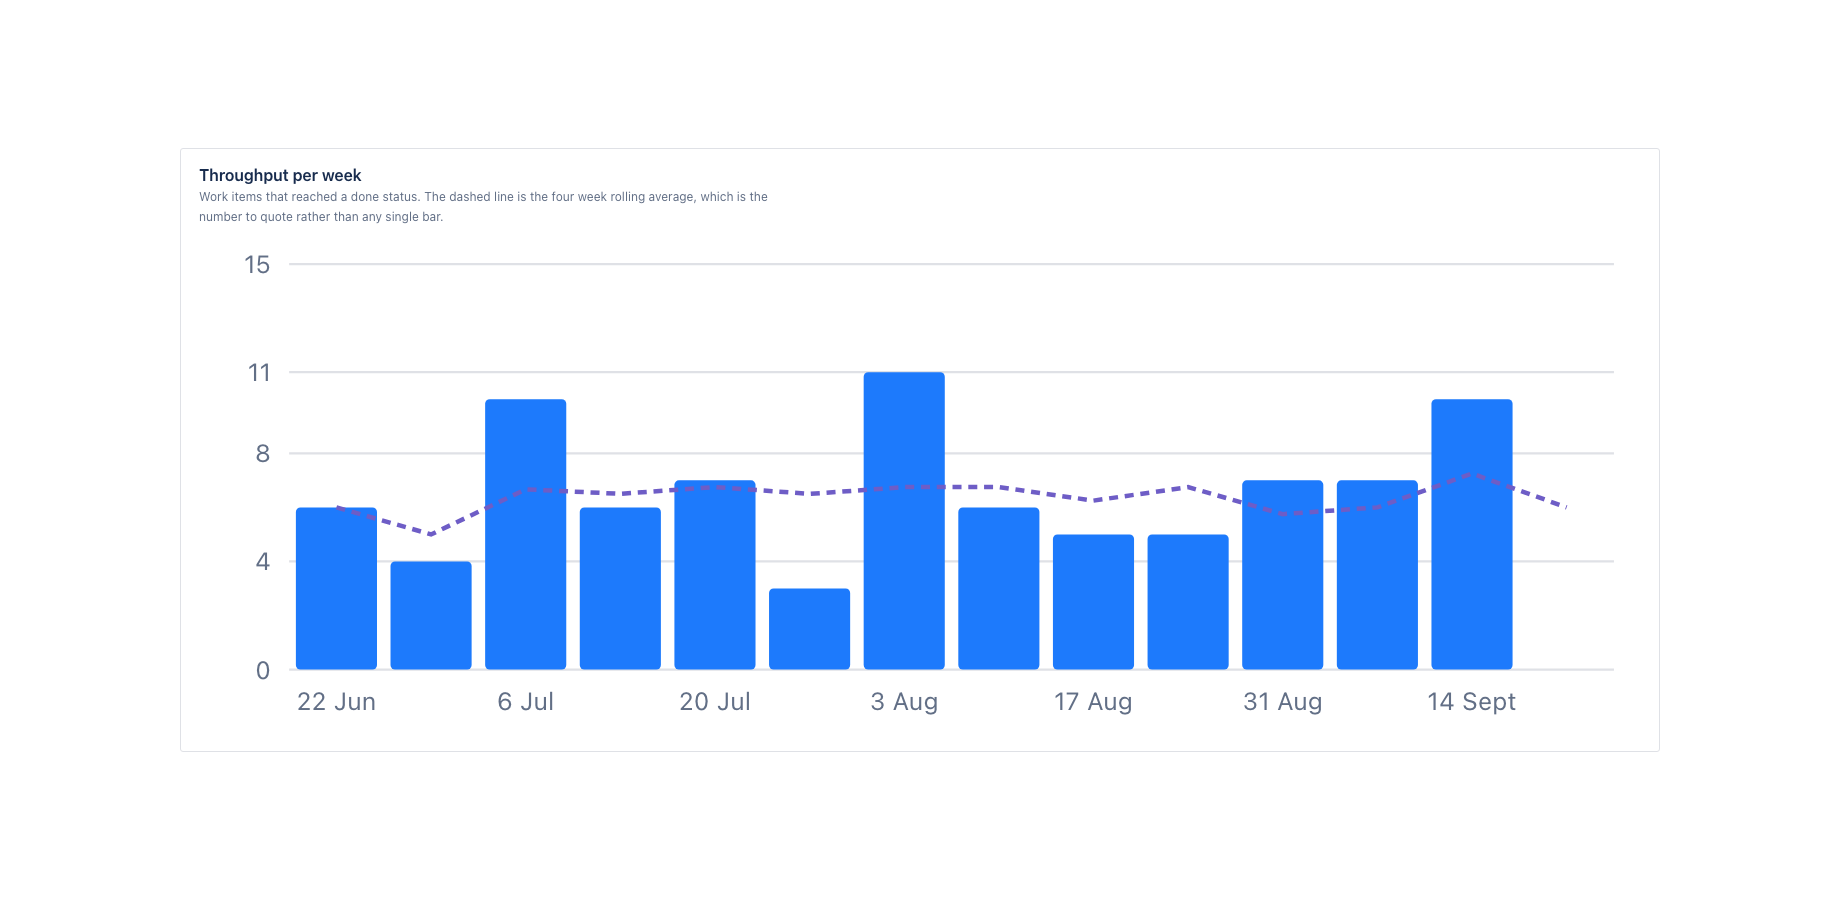
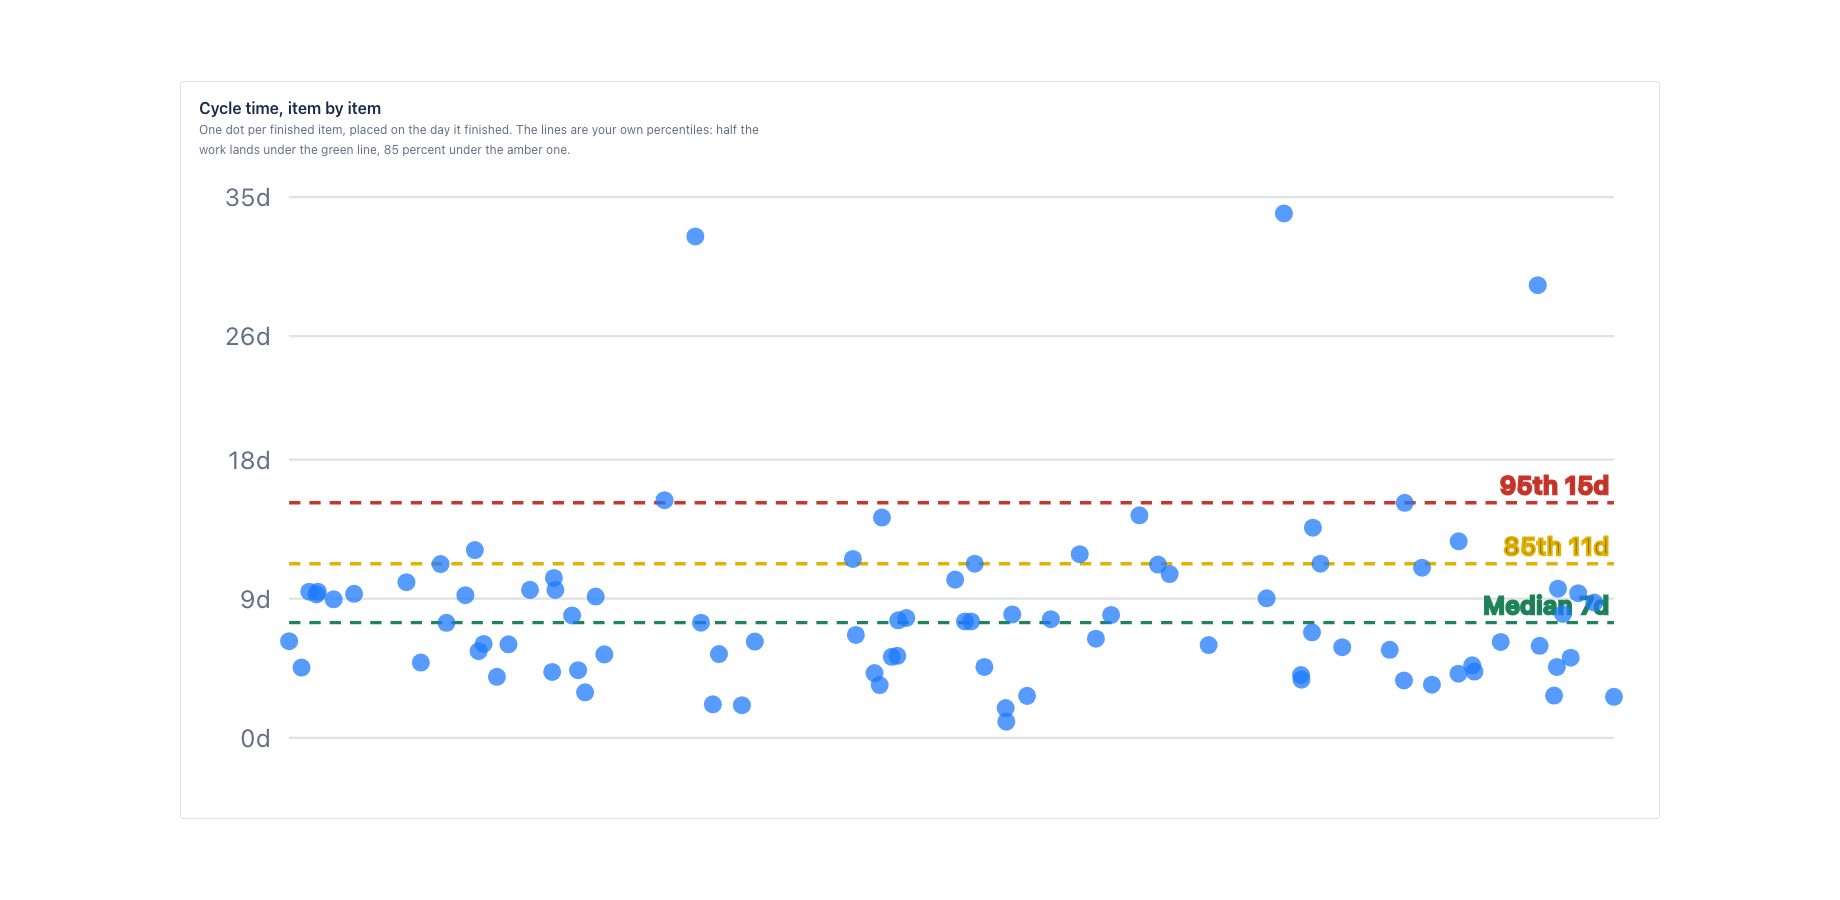
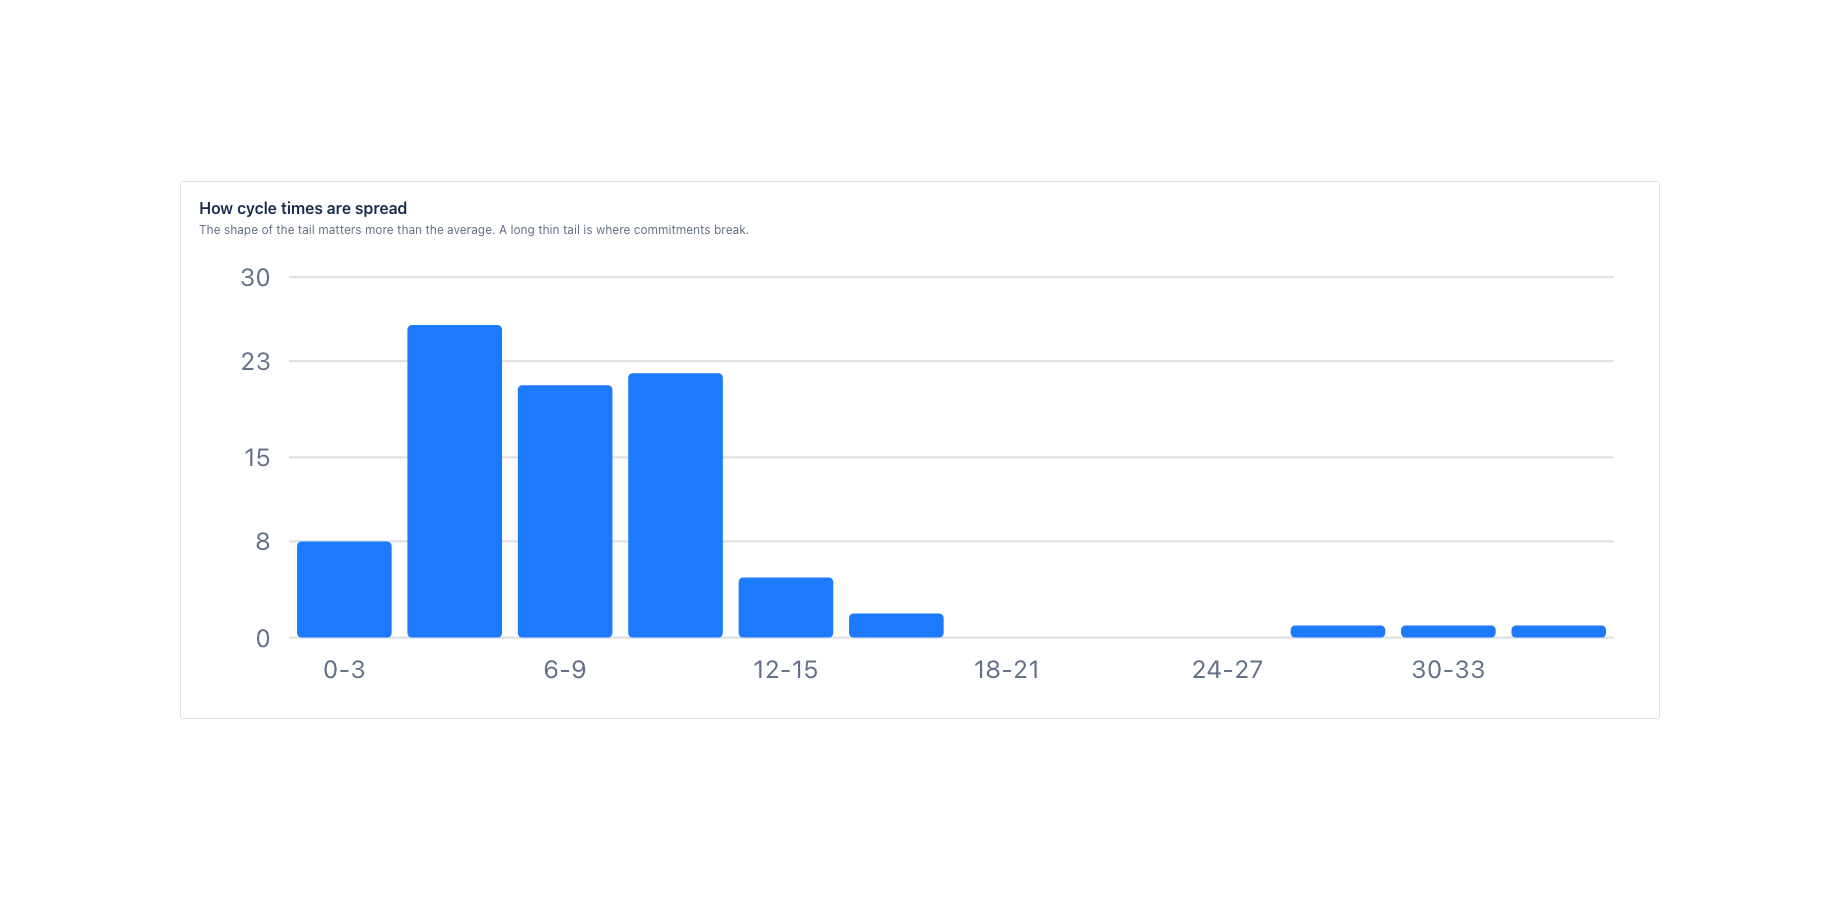
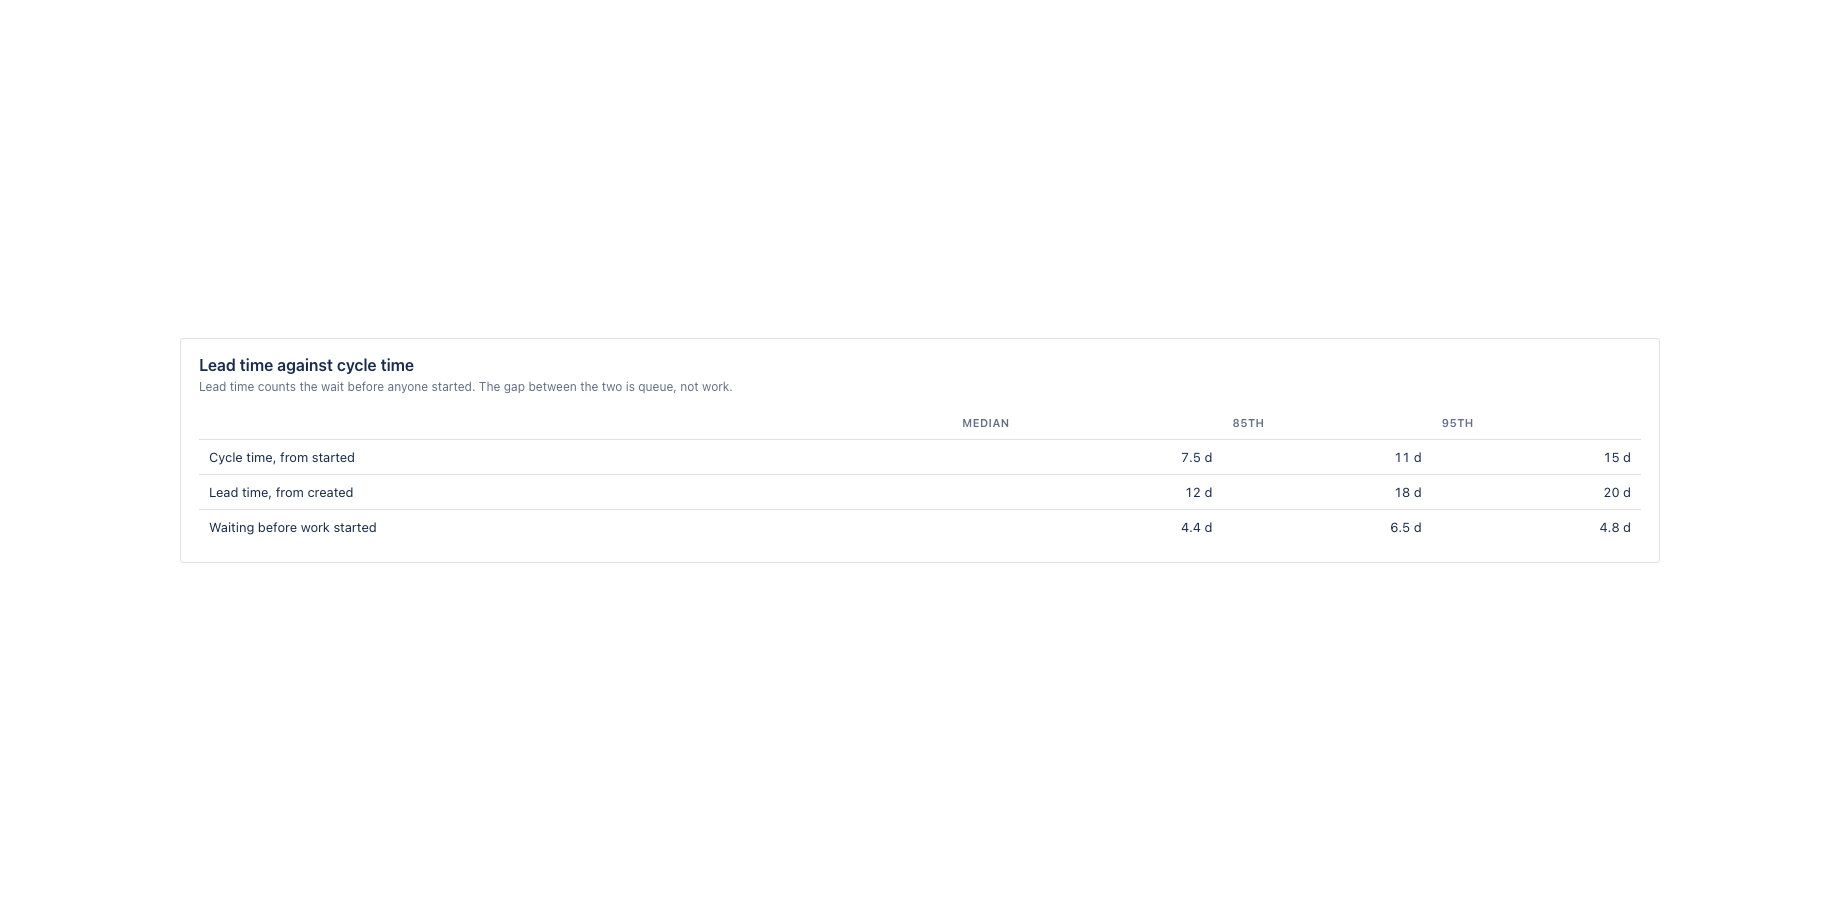
Throughput per week or per month, with a four period rolling average drawn through the bars, because the rolling number is the one worth quoting and a single week never is. Cycle time as a scatter: one dot per finished item, on the day it finished, with your median, 85th and 95th percentile drawn across it. A histogram of the same cycle times, because the shape of the tail is where commitments break. Lead time next to cycle time, with the waiting time before anyone started shown as the difference, which is usually the larger half.
Works with Jira Cloud, company-managed and team-managed projects, and alongside any board or test tool you already run: the numbers come from ordinary work items and their status history, so nothing has to be integrated or migrated.
Demo video
About a minute: the core features and the user flow, recorded in the app's demo mode with sample data from a fictional payments team. Every step carries a caption. Throughput and Cycle Time: how much finishes per week and how long one item takes.
Key features
Percentiles instead of averages
An average cycle time is a number nobody experiences. You get the median, the 85th and the 95th, drawn through every finished item, so you can promise a date that holds 85 times out of 100 rather than half the time.
One dot per finished item
Every item that finished is plotted on the day it finished, at the height of its cycle time. Outliers stop being anecdotes and become a dot you click straight through to the work item behind it.
A verdict on your own predictability
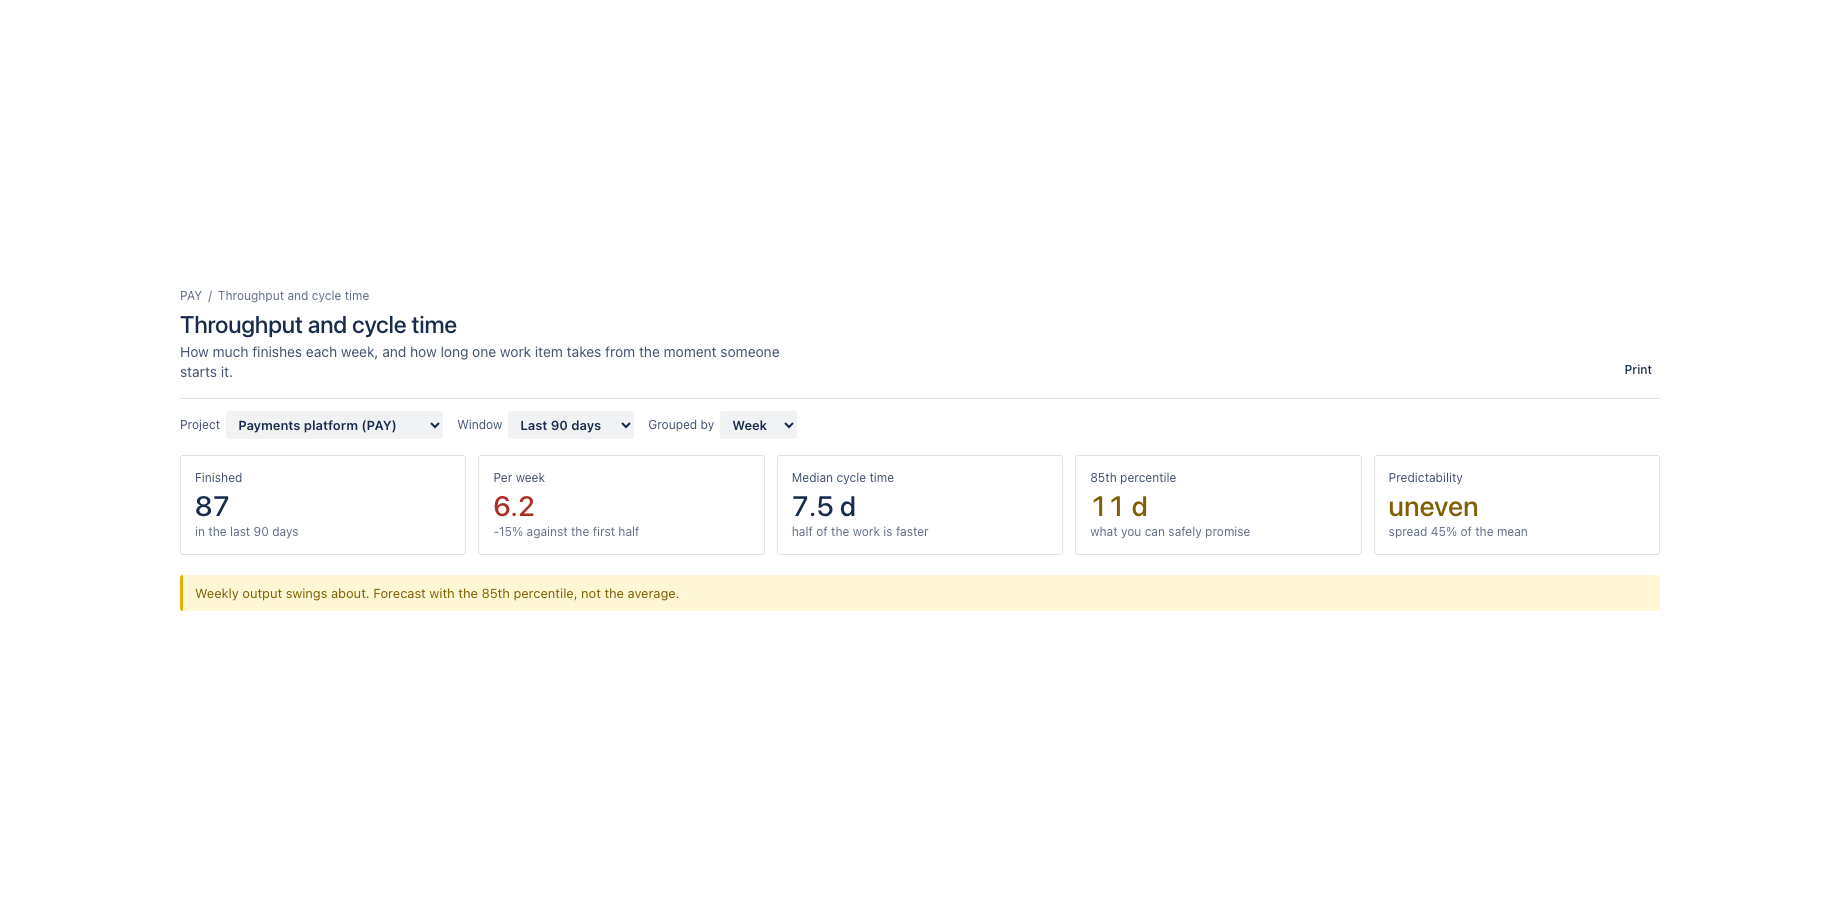
Steady, uneven or erratic, worked out from how much weekly output swings about. One word that tells you whether to forecast from the average or from the 85th percentile.
Cycle time is measured from the moment an item first entered a status in the In Progress category to the moment it reached a Done status, read from the changelog. An item that goes back out of Done restarts the clock and the later completion counts, which is what a team means when they say something was reopened.
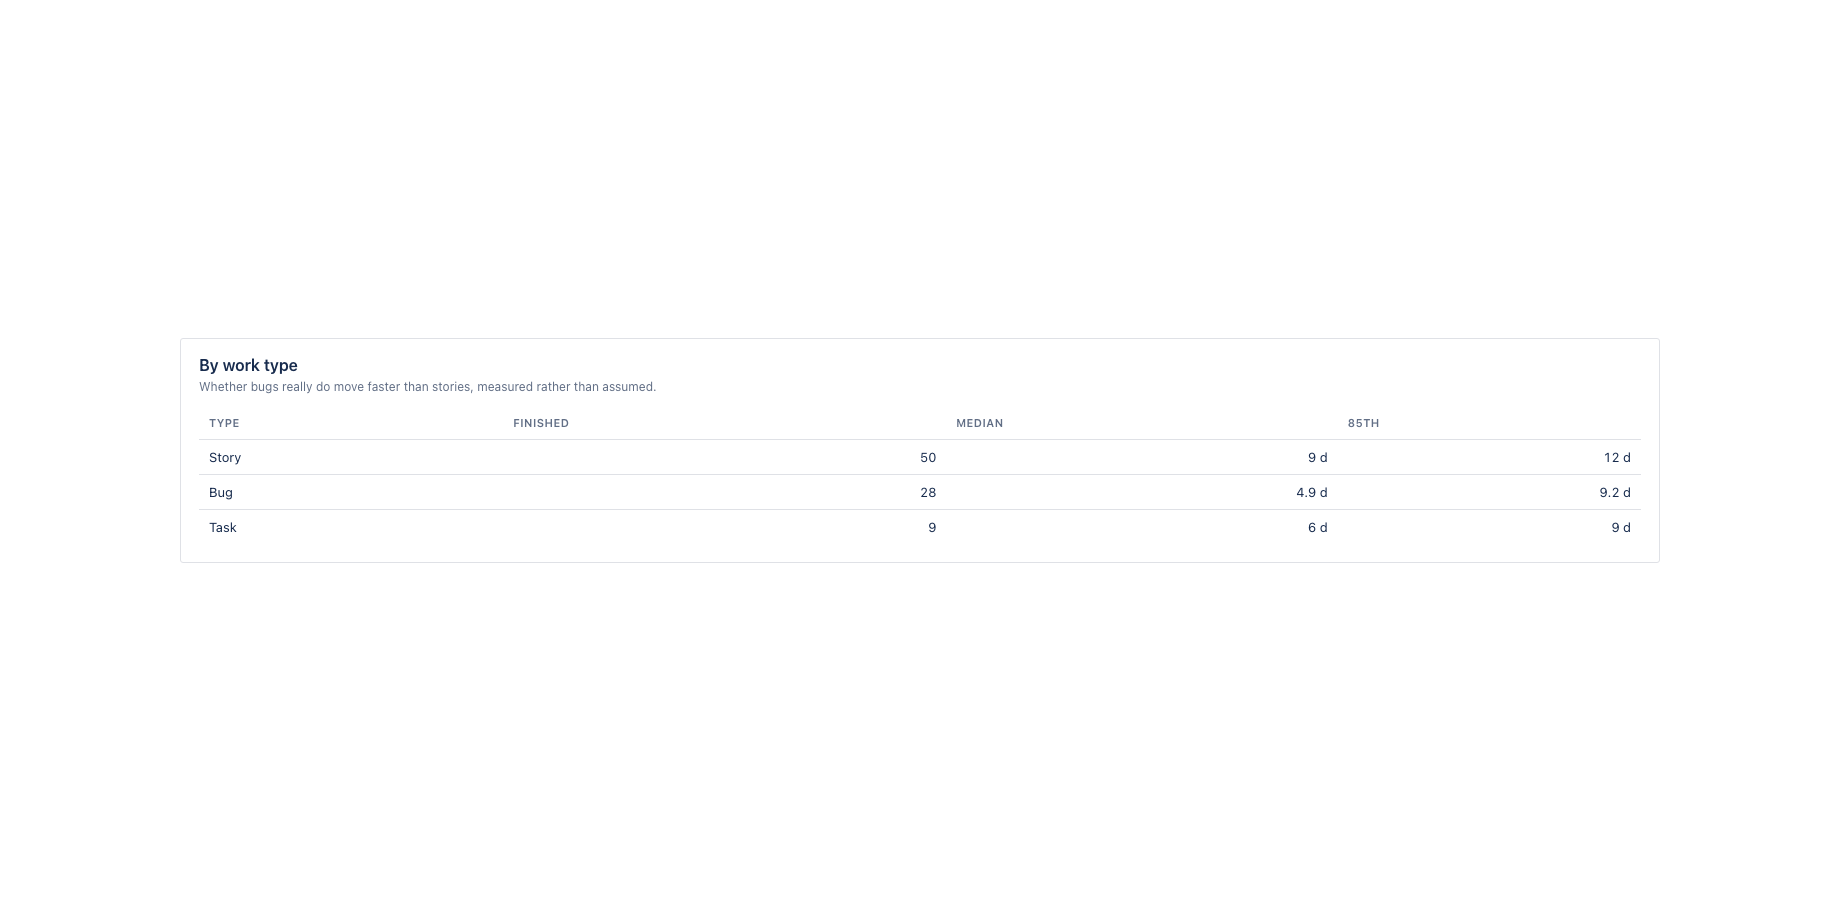
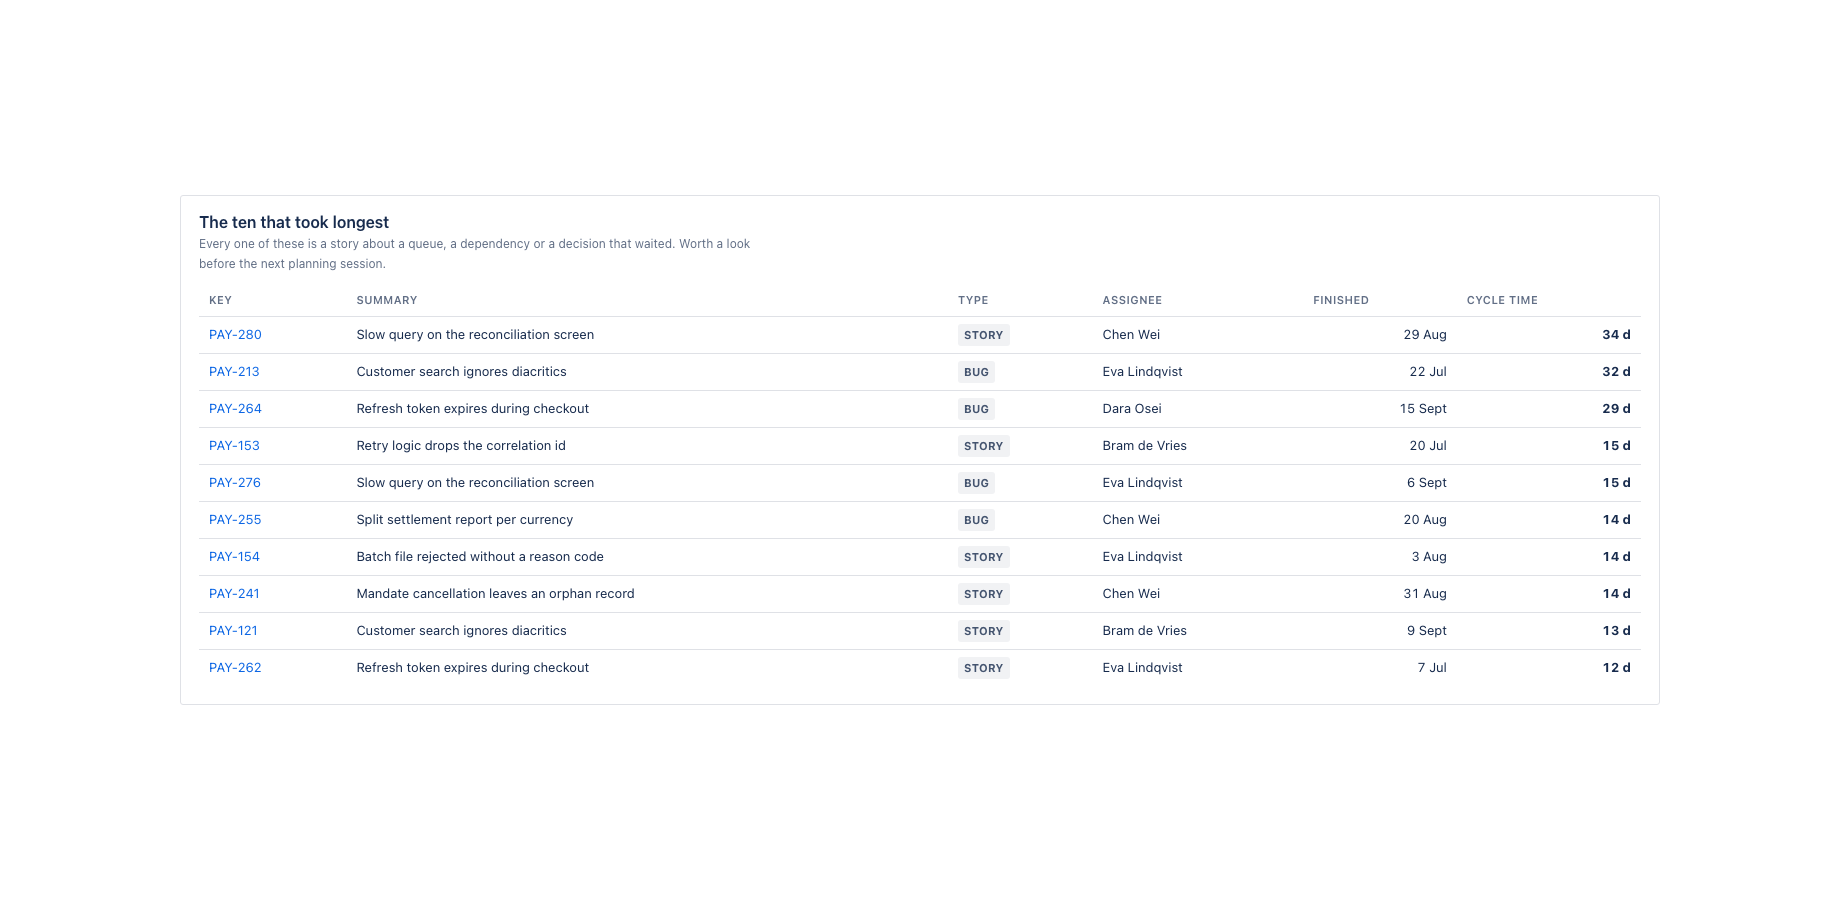
Everything is broken down by work type and by assignee, so the claim that bugs move faster than stories becomes a measurement rather than an argument. The ten items that took longest are listed with their cycle times, and every one of them is a story about a queue, a dependency or a decision that waited.
Scope is a project or any JQL query, over 30, 60, 90, 180 or 365 days, grouped by week or by month. Every number opens the work items behind it, on the page first and in Jira with one click.
Where it appears in Jira
- Project page
- Throughput in the sidebar of every project.
- Global page
- Apps, Throughput and Cycle Time: a project key or any JQL query, across projects.
- Dashboard gadget
- Throughput and Cycle Time gadget with the headline numbers for one project or JQL query.
Install and set up
Before you start
A Jira project with work items that moved into a status of the In Progress category and on to a Done status inside the window you choose. New or empty projects show the page with a clear message that there is no finished work yet.
Install
- In Jira, open Apps in the top bar and choose Explore more apps. Search for Throughput and Cycle Time for Jira and click Try it free. You need to be a Jira site administrator.
- Review the permissions. The app asks for
read:jira-work,read:jira-user,storage:app. It cannot create, change or delete anything in Jira. - The 30 day trial starts on install. Billing after the trial is per user through Atlassian; nothing is charged if you uninstall before the trial ends.
Set up
- Open a Jira project. In the project sidebar, click Throughput. The page computes straight away from the status history Jira already keeps; there is no sync or import step.
- At the top of the page choose the window (30, 60, 90, 180 or 365 days) and the grouping (week or month). The choice is remembered per project.
- For a view across projects, open Apps in the top bar and choose Throughput and Cycle Time. Enter a project key or any JQL query.
- For a dashboard, open a Jira dashboard, click Edit, then Add gadget, search for Throughput and Cycle Time and add it. Set the project or JQL in the gadget configuration.
Using the app
The steps below follow the demo video, in the same order.
- Choose the project, the window and the grouping; everything on the page recomputes
- Headline: finished, per week, median and 85th percentile cycle time, and a predictability verdict
- Throughput per week, with the four week rolling average as the number to quote
- Cycle time item by item, against your own median, 85th and 95th percentile
- The spread of cycle times, and lead time against cycle time: the gap is queue, not work
- By work type and by assignee: measured, not assumed
- The ten that took longest, each one a story about a queue or a decision that waited
- Every list opens the same selection in Jira, and the page prints cleanly for a report
Verify it works
A short test script. Each step names what to do and what you should see. Together they cover every module of the app.
| # | Do this | Expected result |
|---|---|---|
| 1 | Open the Throughput tab on a project with finished work in the last 90 days. | The headline shows finished items, items per week, median and 85th percentile cycle time, and a predictability verdict. |
| 2 | Click the Finished number. | A list of the finished work items; each key opens in Jira. These are the items that reached a Done status inside the window. |
| 3 | Hover a dot in the cycle time scatter. | Key, cycle time in days and the day it finished. |
| 4 | Move one finished item back to In Progress and then to Done again in Jira, then reload. | The item's cycle time now runs to the later completion; the earlier completion no longer counts. |
| 5 | Switch the window to 30 days and reload the page. | The numbers recompute and the 30 day choice is remembered for this project. |
| 6 | Open Apps, Throughput and Cycle Time and enter a JQL query. | The same report for that query. |
| 7 | Add the gadget to a dashboard. | Headline numbers match the project tab for the same project and window. |
Screenshots
Permissions and data
Scopes and why
- read:jira-work: read work items, their fields and their changelog to compute throughput, cycle time and lead time.
- read:jira-user: show assignee display names.
- storage:app: keep the chosen project, window and grouping per project on the customer's site.
What the app stores
The chosen project, window and grouping per project. No work item content.
Everything is stored in Forge app storage on your own Atlassian site and removed under the Forge storage lifecycle when you uninstall. The app calls no external service, sends nothing out of Atlassian and uses no analytics. Data residency follows your site.
More in the privacy policy and the security policy for the apps.
Pricing, trial and support
Paid via Atlassian, per user, monthly or yearly, with a 30 day free trial. The current price for your user tier is on the Marketplace listing. Billing, invoices and cancellation run through your Atlassian site administration.
Questions, bugs and feature requests go to contact@toine.com. I answer within two working days, Monday to Friday, CET. Please add your site URL, the app name and a screenshot. Security issues go first: put "security" in the subject line. Terms are on the terms and licence page.