Documentation · Jira Cloud · Toine.com B.V.
Cumulative Flow Diagram for Jira
Every workflow status as a band, reconstructed from the complete status history of your work items. Work in progress, arrival rate, delivery rate and the lead time those three imply, all measured over the same window.
Marketplace listing · 30 day free trial, paid via Atlassian · Support: contact@toine.com · Updated 2026-10-07
What it does
Cumulative Flow Diagram for Jira draws the chart that shows a delivery system rather than a list of tickets.
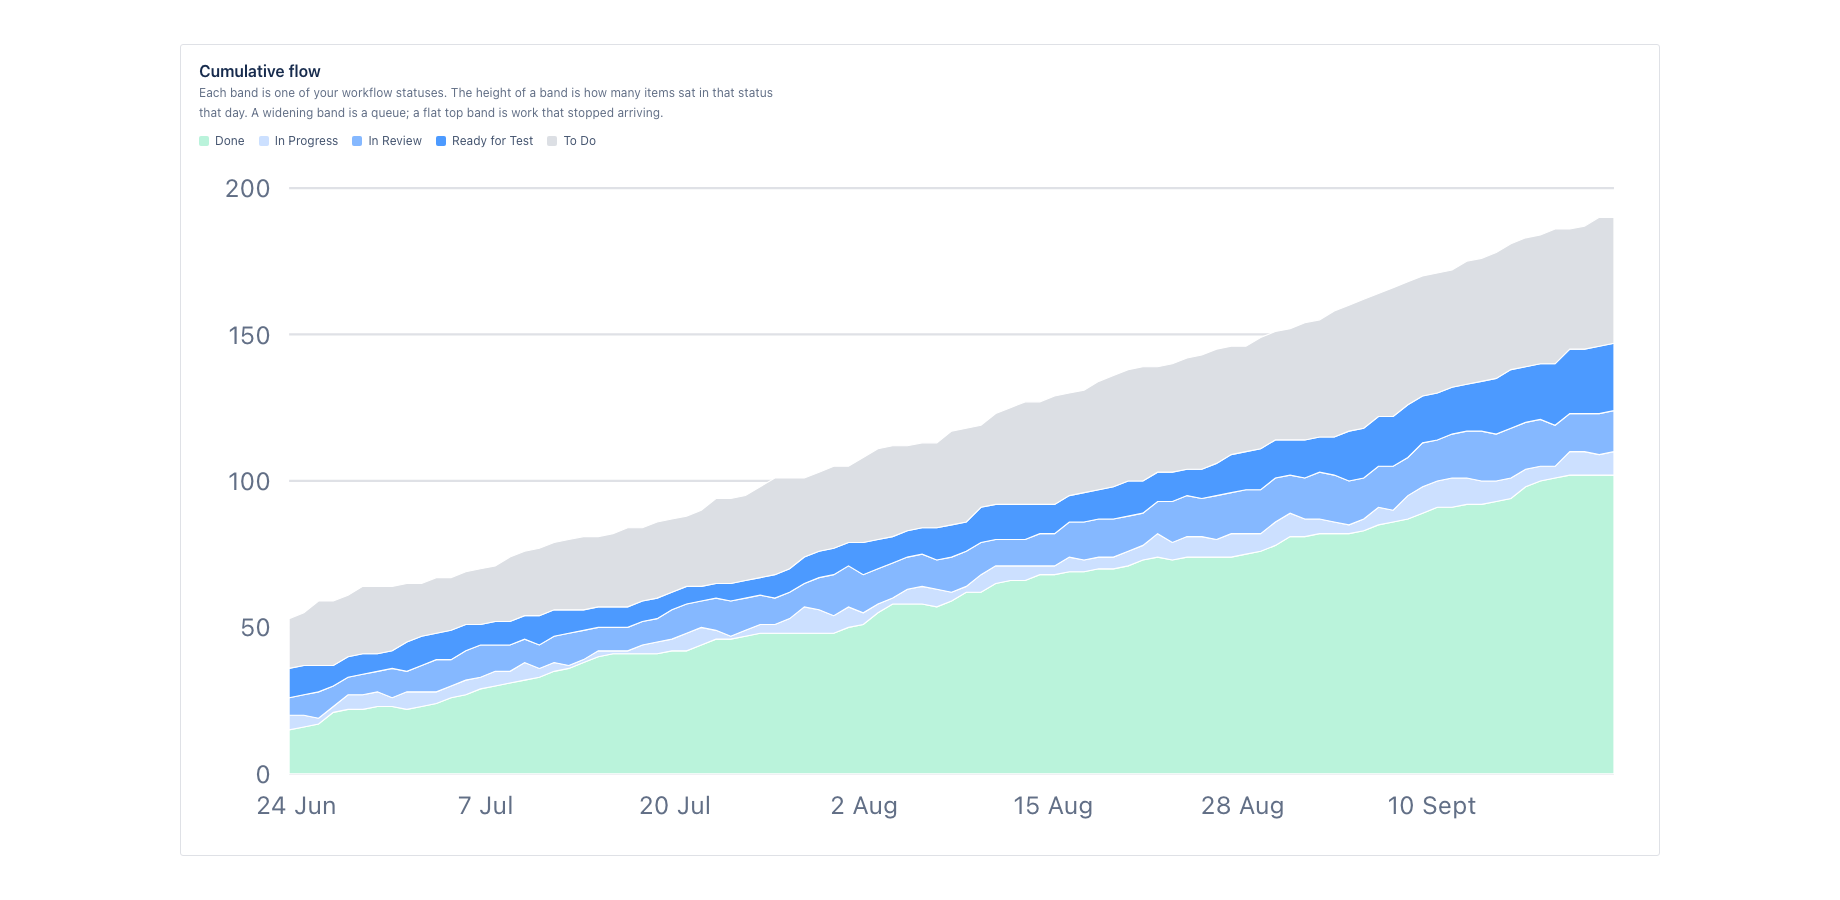
Each band is one of your workflow statuses. The height of a band on any day is how many work items sat in that status that day. A band that widens as it moves right is a queue forming. A top band that flattens is work that stopped arriving. The vertical distance across the middle bands is work in progress, and the horizontal distance across them is roughly how long an item takes to cross the system.
It is rebuilt by replaying the status transitions Jira already stores, so the diagram covers your real history from the first minute. Most cumulative flow apps start collecting on the day they are installed, which makes them useless for the first quarter, exactly when a team most wants to know whether things are getting better.
Works with Jira Cloud, company-managed and team-managed projects, and with any workflow, however many statuses it has.
Demo video
About a minute: the core features and the user flow, recorded in the app's demo mode with sample data from a fictional payments team. Every step carries a caption. Cumulative Flow Diagram: rebuilt from the full history, readable on the day you install it.
Key features
Useful on the day you install it
The diagram is rebuilt from the full status history that Jira already holds, not collected from the day the app arrives. You get a year of flow on your first afternoon instead of waiting a quarter for data.
Your workflow, not three generic columns
Every status that occurs in the data gets its own band, in the conventional stacking with done at the bottom. An eight column workflow is drawn as eight bands rather than flattened into to do, doing and done.
Three rates, one window
Arrival rate, delivery rate and average work in progress are all measured over the same period, which is what makes the lead time they imply worth quoting instead of a number pulled from thin air.
Done sits at the bottom, work in progress in the middle, backlog on top, which is the conventional stacking that anyone who has read a cumulative flow diagram before will recognise. Statuses the site does not know about are still drawn rather than silently dropped.
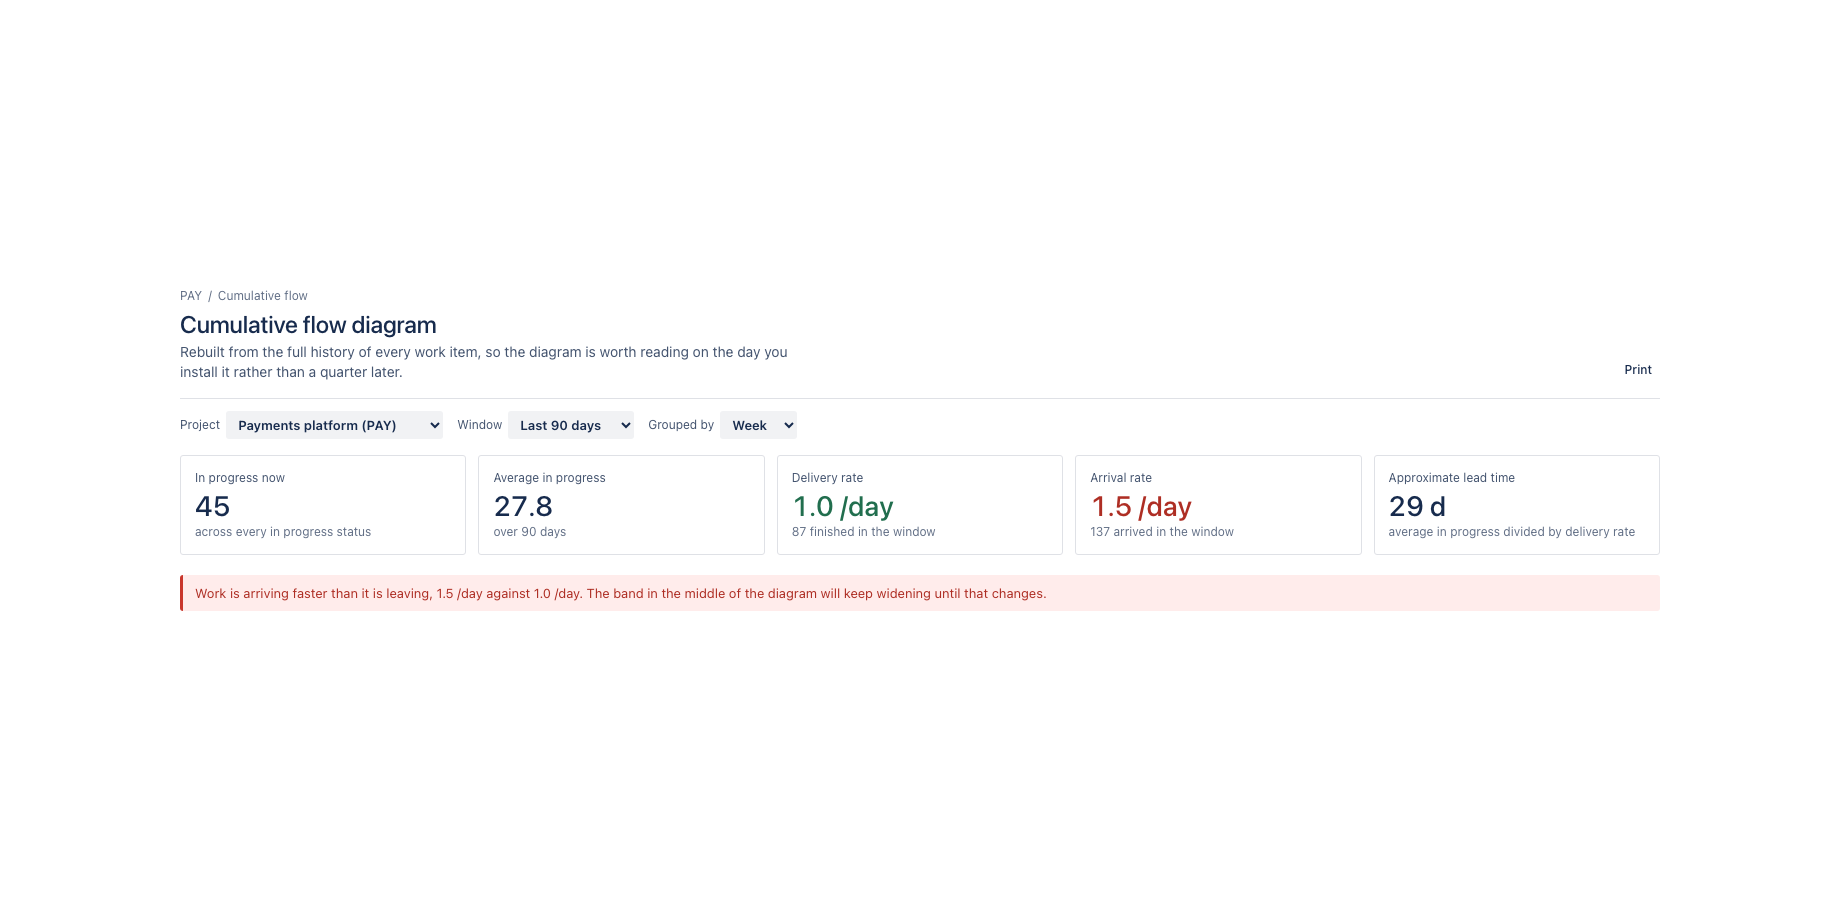
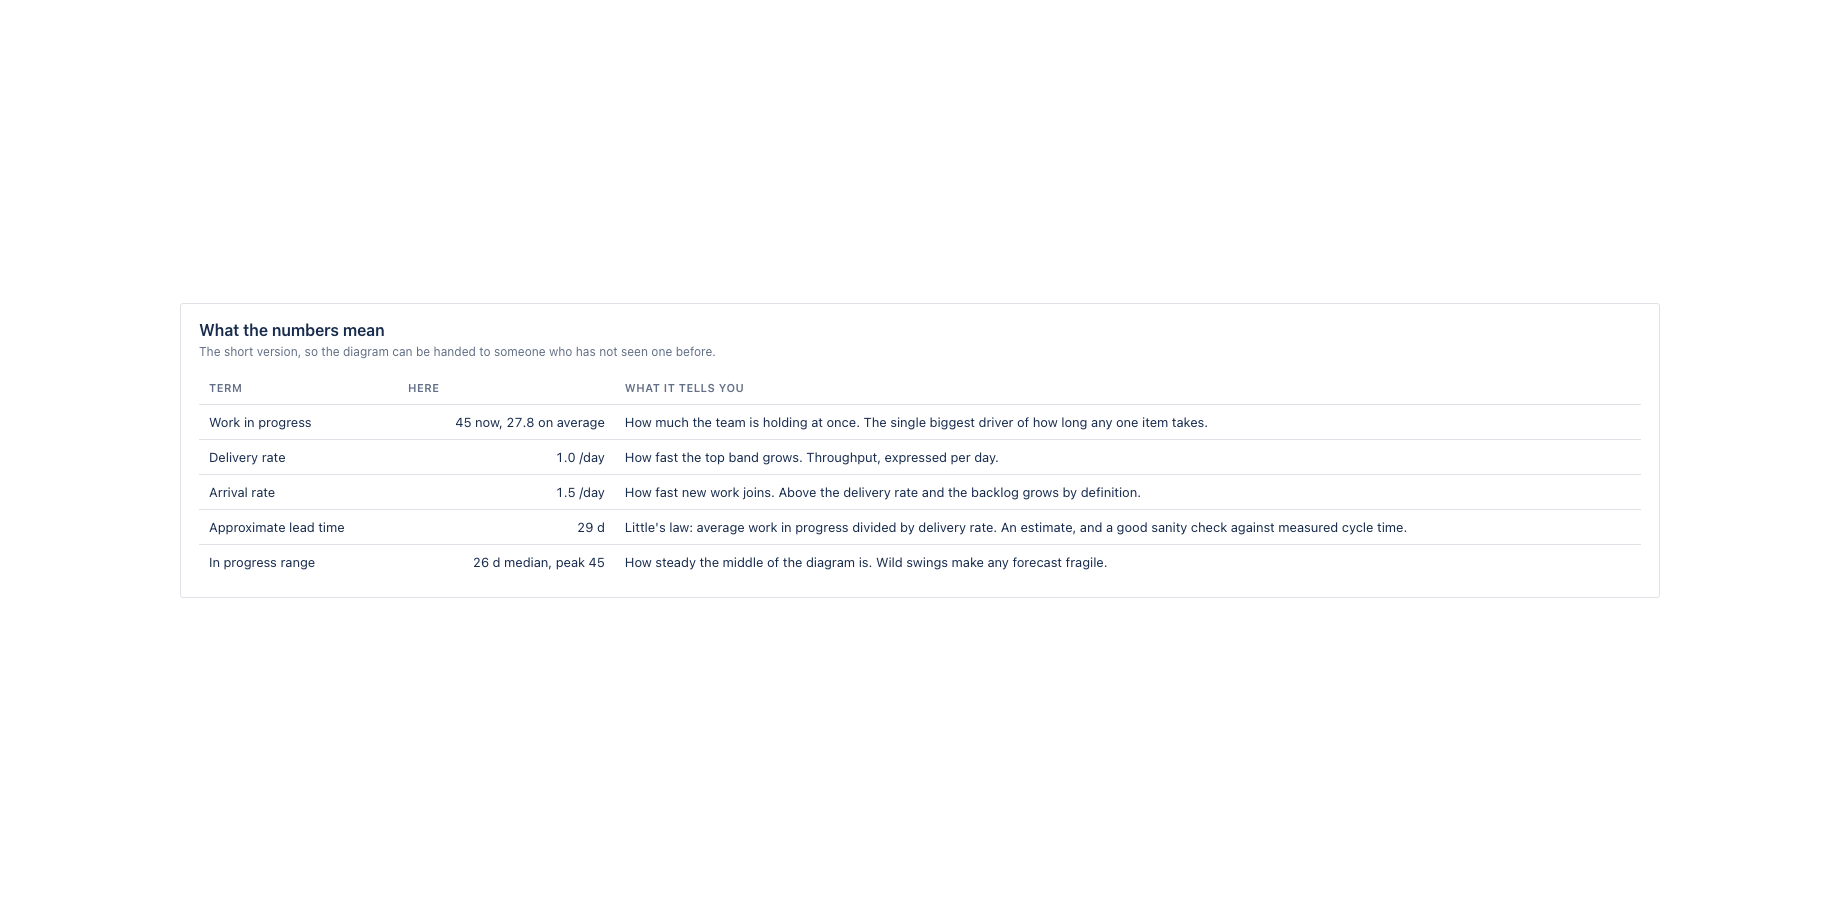
Underneath the diagram sit the three numbers it implies. Arrival rate: how fast new work joins, per day. Delivery rate: how fast work reaches a done status, per day. Average work in progress across the window. From those, the approximate lead time by Little's law, average work in progress divided by delivery rate. All three come from the same window, which is the condition under which that arithmetic is honest, and the app says plainly when arrival is running ahead of delivery.
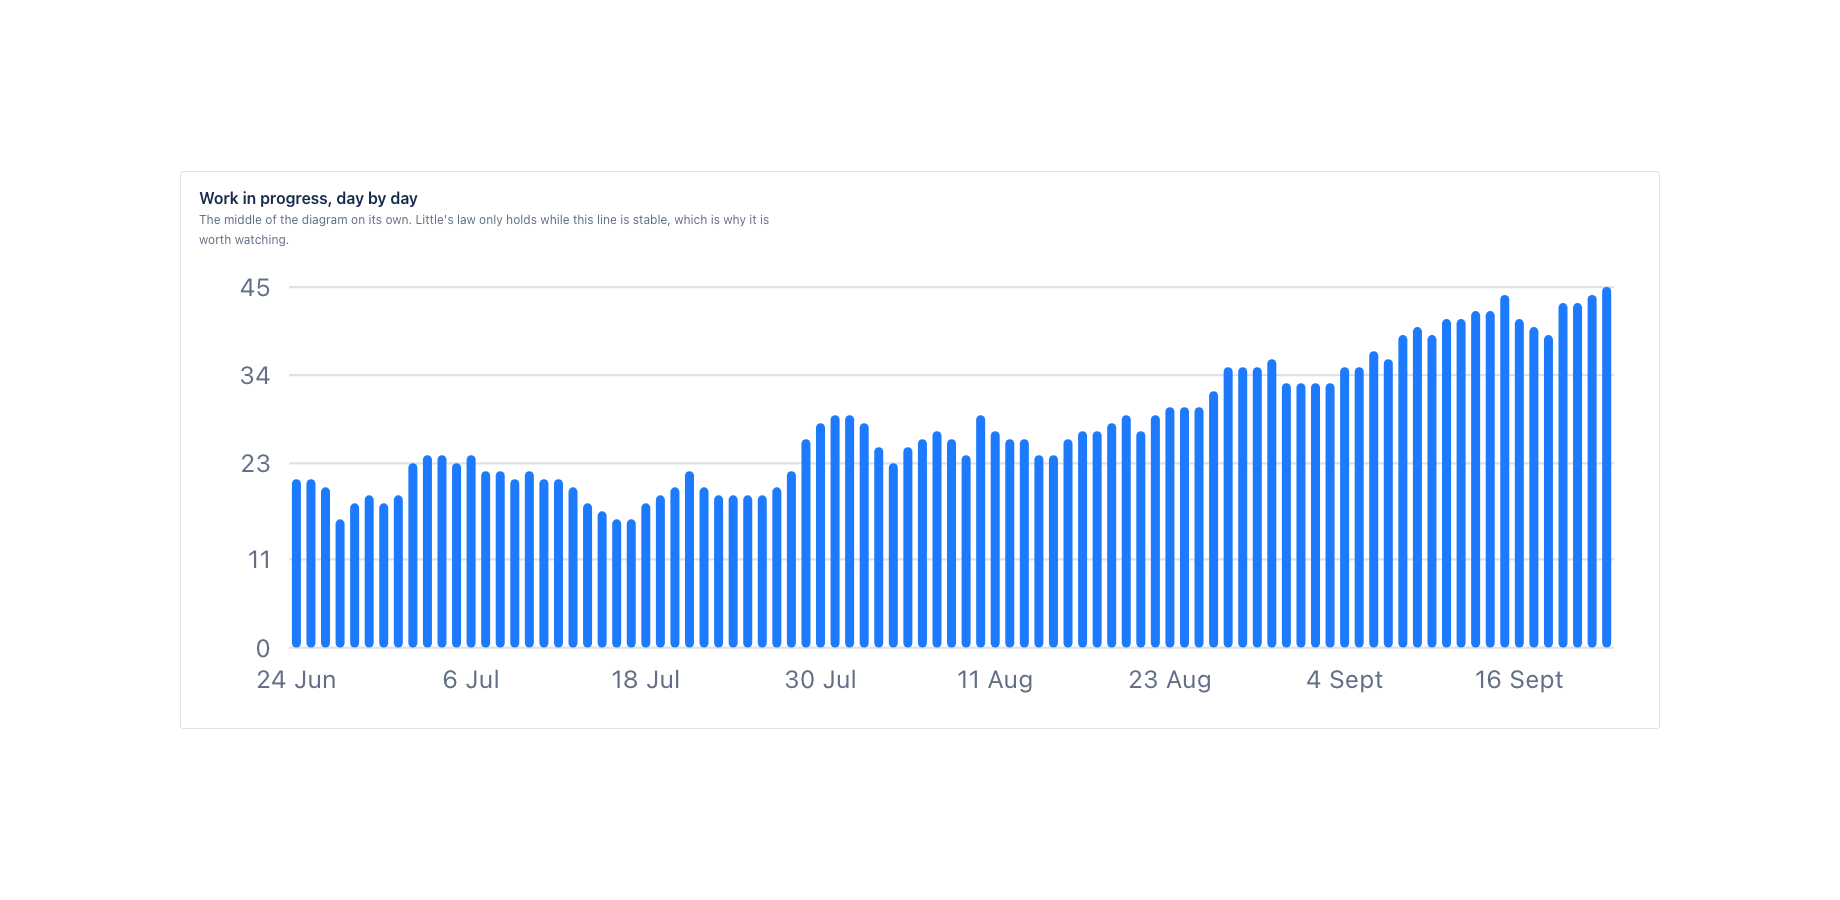
A separate chart shows work in progress day by day on its own, because Little's law only holds while that line is stable, and a short glossary panel explains each term so the diagram can be handed to someone who has never read one.
Scope is a project or any JQL query, over 30, 60, 90, 180 or 365 days.
Where it appears in Jira
- Project page
- Cumulative flow in the sidebar of every project.
- Global page
- Apps, Cumulative Flow Diagram: a project key or any JQL query, across projects.
- Dashboard gadget
- Cumulative Flow Diagram gadget with the headline numbers for one project or JQL query.
Install and set up
Before you start
A Jira project with work items that moved into a status of the In Progress category and on to a Done status inside the window you choose. New or empty projects show the page with a clear message that there is no finished work yet.
Install
- In Jira, open Apps in the top bar and choose Explore more apps. Search for Cumulative Flow Diagram for Jira and click Try it free. You need to be a Jira site administrator.
- Review the permissions. The app asks for
read:jira-work,read:jira-user,storage:app. It cannot create, change or delete anything in Jira. - The 30 day trial starts on install. Billing after the trial is per user through Atlassian; nothing is charged if you uninstall before the trial ends.
Set up
- Open a Jira project. In the project sidebar, click Cumulative flow. The page computes straight away from the status history Jira already keeps; there is no sync or import step.
- At the top of the page choose the window (30, 60, 90, 180 or 365 days) and the grouping (week or month). The choice is remembered per project.
- For a view across projects, open Apps in the top bar and choose Cumulative Flow Diagram. Enter a project key or any JQL query.
- For a dashboard, open a Jira dashboard, click Edit, then Add gadget, search for Cumulative Flow Diagram and add it. Set the project or JQL in the gadget configuration.
Using the app
The steps below follow the demo video, in the same order.
- Choose the project, the window and the grouping; everything on the page recomputes
- Headline: in progress now, average, delivery rate, arrival rate and approximate lead time
- A plain words warning when work arrives faster than it leaves
- The diagram: one band per workflow status, done at the bottom; a widening band is a queue
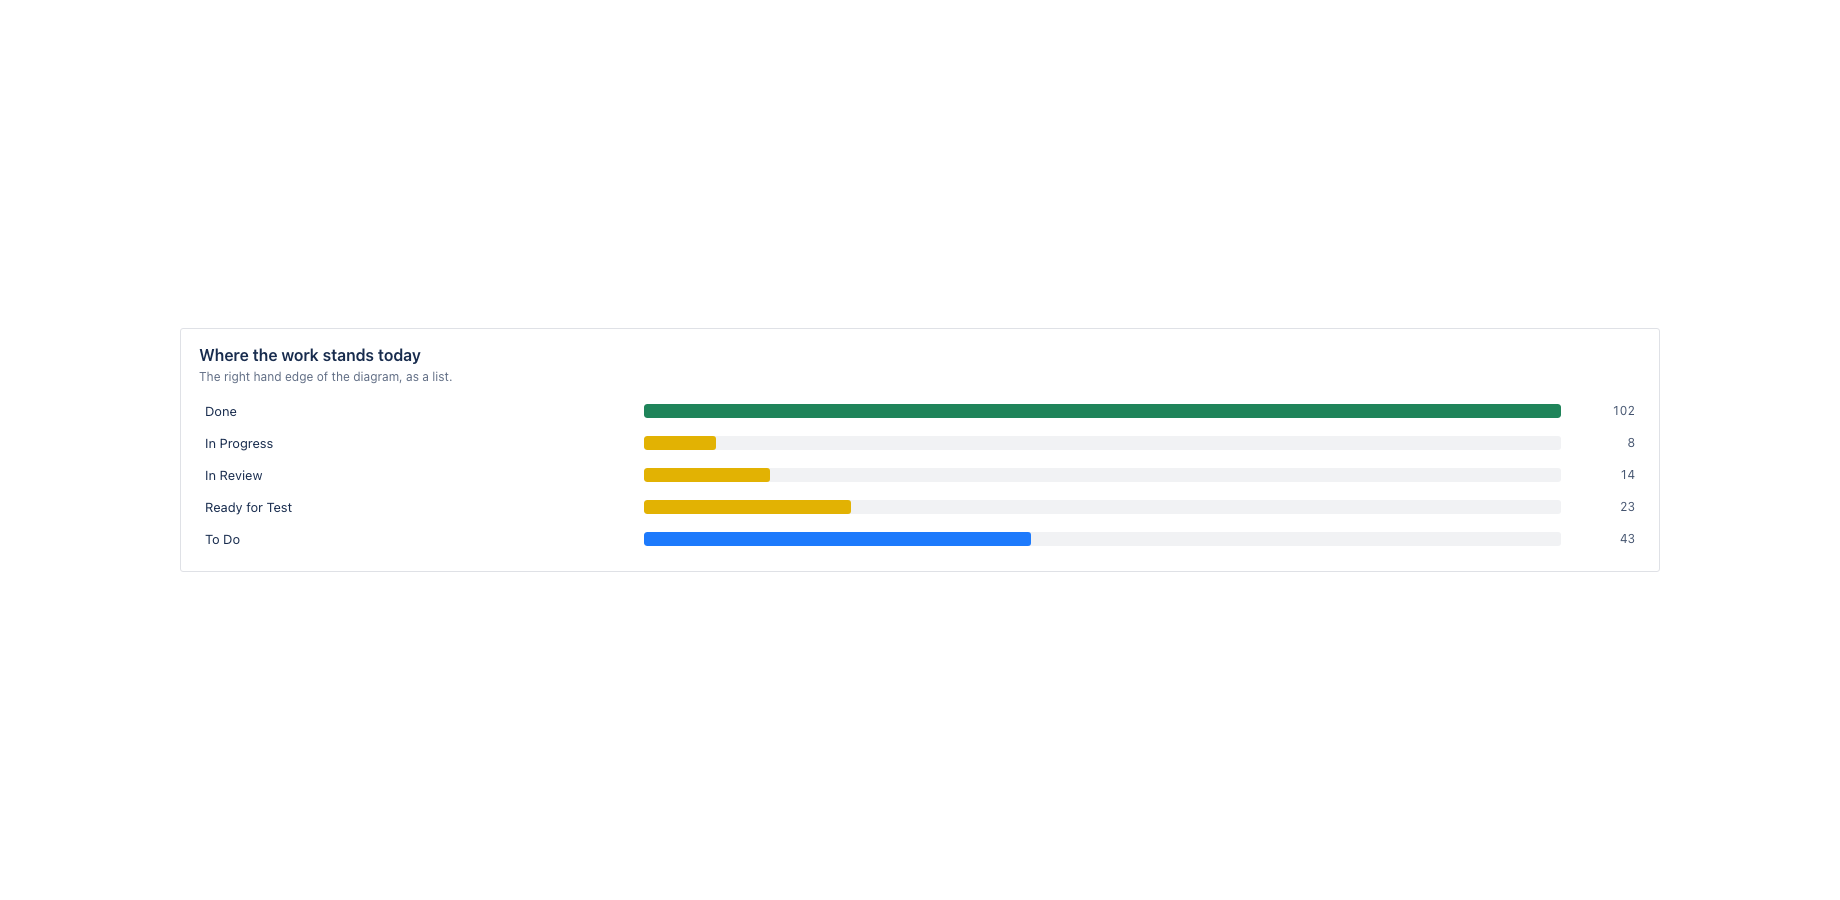
- Work in progress day by day, and where the work stands today
- What the numbers mean: Little's law and the other terms, explained for the reader
- Every list opens the same selection in Jira, and the page prints cleanly for a report
Verify it works
A short test script. Each step names what to do and what you should see. Together they cover every module of the app.
| # | Do this | Expected result |
|---|---|---|
| 1 | Open the Cumulative flow tab on a project with a few months of history. | The diagram shows one band per workflow status from the first day of the window, done at the bottom. No waiting period; the history is replayed from the changelog. |
| 2 | Read the headline. | Work in progress now, average work in progress, delivery rate, arrival rate and the approximate lead time (average WIP divided by delivery rate). |
| 3 | Hover a day in the diagram. | The count per status on that day. |
| 4 | Open Where the work stands today. | A clickable list per status; the counts equal the right-hand edge of the diagram. |
| 5 | Pick a window in which more work was created than finished. | A plain words warning says arrival is running ahead of delivery. |
| 6 | Open What the numbers mean. | Little's law and the other terms, explained. |
Screenshots
Permissions and data
Scopes and why
- read:jira-work: read work items and their changelog to replay status transitions day by day.
- read:jira-user: show assignee display names.
- storage:app: keep the chosen project, window and grouping per project on the customer's site.
What the app stores
The chosen project, window and grouping per project. No work item content.
Everything is stored in Forge app storage on your own Atlassian site and removed under the Forge storage lifecycle when you uninstall. The app calls no external service, sends nothing out of Atlassian and uses no analytics. Data residency follows your site.
More in the privacy policy and the security policy for the apps.
Pricing, trial and support
Paid via Atlassian, per user, monthly or yearly, with a 30 day free trial. The current price for your user tier is on the Marketplace listing. Billing, invoices and cancellation run through your Atlassian site administration.
Questions, bugs and feature requests go to contact@toine.com. I answer within two working days, Monday to Friday, CET. Please add your site URL, the app name and a screenshot. Security issues go first: put "security" in the subject line. Terms are on the terms and licence page.